Our Vanishing Glaciers: Visualizing a Half-Century of Glacier Loss in Glacier National Park, Montana
By Lis Fano, University of Kentucky.
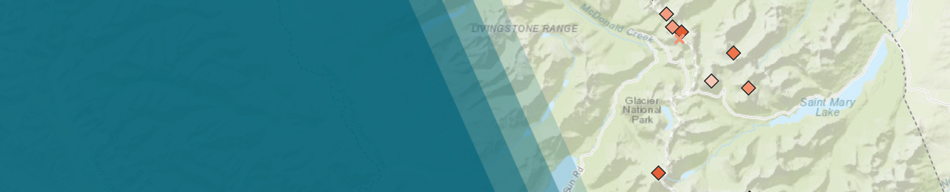
See the projectOver 150 alpine glaciers existed in Glacier National Park, Montana at the end of the Little Ice Age (mid-19th century). In 1966, the park had 35 named glaciers large enough to be considered active. By 2015, only 26 of those glaciers remained. The average area loss was 39 percent, though some glaciers lost as much as 85 percent. The loss and rapid retreat of these small alpine glaciers reflect changes in climate as glaciers respond to changes in temperature and precipitation.
The United States Geological Survey (USGS) has been documenting glacier area loss within the park since 1966. These data consists of a time series of digitized glacier outlines for the 35 named glaciers within Glacier National Park and an additional two glaciers managed by the adjacent USDA Forest Service Flathead National Forest. The polygon features represent the main body portion of each glacier as analyzed from aerial imagery from the years 1966, 1998, 2005 and 2015, marking approximately 50 years of change in glacier area. A maximum glacier extent dataset derived from terminal moraine locations from the mid-19th century Little Ice Age (LIA) is also included in this interactive visualization tool.
This web mapping project integrates the digitized glacier outlines for all years, displays them interactively, and combines them with local climate data downloaded from the Northwest Alliance for Computational Science and Engineering, Parameter-elevation Regressions on Independent Slopes Model (PRISM) website.
The technology stack for this application includes HTML/SVG/CSS/JS, jQuery, and Leaflet. The responsive and user interface framework includes the use of Mapbox’s Assembly.css and vanilla JavaScript. D3.js has been used as the charting library, and chroma.js to determine the color scales used in symbolizing the glacier points.
The application is designed to provide both the professional and public audience an interactive web experience that visualizes the decrease in glacier extent over time.