Hypoxia: Low Oxygen Events of the Pacific Northwest Coast
By Michala Garrison, University of Oregon.
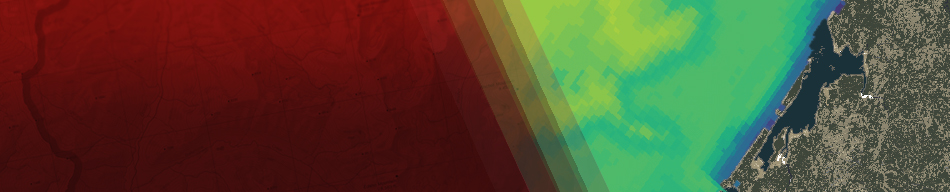
See the projectHypoxia, or oxygen depletion, is an environmental phenomenon where the concentration of dissolved oxygen in a water column decreases to a level which can no longer support living aquatic organisms. I worked with Dr. Samantha Siedlecki, a biogeochemical oceanographer at the University of Connecticut, to get the hypoxia data. The map illustrates that hypoxia events occur in the Pacific Ocean off the coast of Oregon and Washington and that they occur during periods of coastal upwelling (April-September). To communicate that hypoxia extent and severity is dependent on coastal upwelling, I included three maps of hypoxia at different times of the year. The small “May 2018” map shows hypoxia extent during the beginning of the upwelling period, the “October 2018” map shows hypoxia extent during the end of the upwelling period, and the large “August 2018” map shows hypoxia extent when it is the most severe. By comparing the three maps, the reader can see how hypoxia extent and severity grows during periods of upwelling. I recreated a graph that Dr. Siedlecki sent me which illustrates the historical record of low oxygen events for Oregon and Washington. I added a block of color to the background of the graph that indicates the upwelling period. The reader can see the oxygen data points decrease during that period and become more hypoxic. I also created the terrain layer of this map in photoshop from a land cover dataset and a DEM. Something I wanted to communicate as well was how hypoxia affects marine life and humans so I added the callouts with a narrative of real events in the bottom right of the map.